


Content Performance Metrics: 15+ Key KPIs Every Marketer Should Track

Whether you are new to the field or a seasoned content creation expert, the biggest challenge remains the same: “How do I write content that is both creative and effective?” So is there a formula for creating high-quality, high-performing content? Are KPIs really necessary for content creators? Which KPIs matter most for content performance? Let’s explore these questions to level up your writing skills and optimize the performance of your content.
KPIs: The “Key” to Content Performance
Content creation is not only a passion, but also a game of effectiveness. No matter how much heart you pour into every word, if you don’t know whether your work truly resonates with readers, all that effort is wasted. Is your article compelling enough to attract and retain readers, or is it just dry text on a page?
Don’t worry, the answer lies in numbers that speak for themselves – KPIs. They are the true measure of the value of every effort you put in. That is why marketers place so much importance on optimizing content performance (CP), a never-ending process that starts with identifying underperforming content, then carefully refining every sentence and image until you hit your goals and KPIs.

The first step to optimizing content performance is to re-evaluate the content on your site:
- Review the traffic of your posts to identify which ones perform best. Analyze the content, the numbers, and the factors that made those posts popular.
- Look at keyword difficulty and the rankings of related posts.
- Compare your performance with competitors in your industry.
Based on this information, propose specific ways to improve content performance and the quality of each post.
15+ “Golden” Metrics for Measuring Content Performance
SEO Metrics
Pageviews: the first metric to reveal your content’s appeal
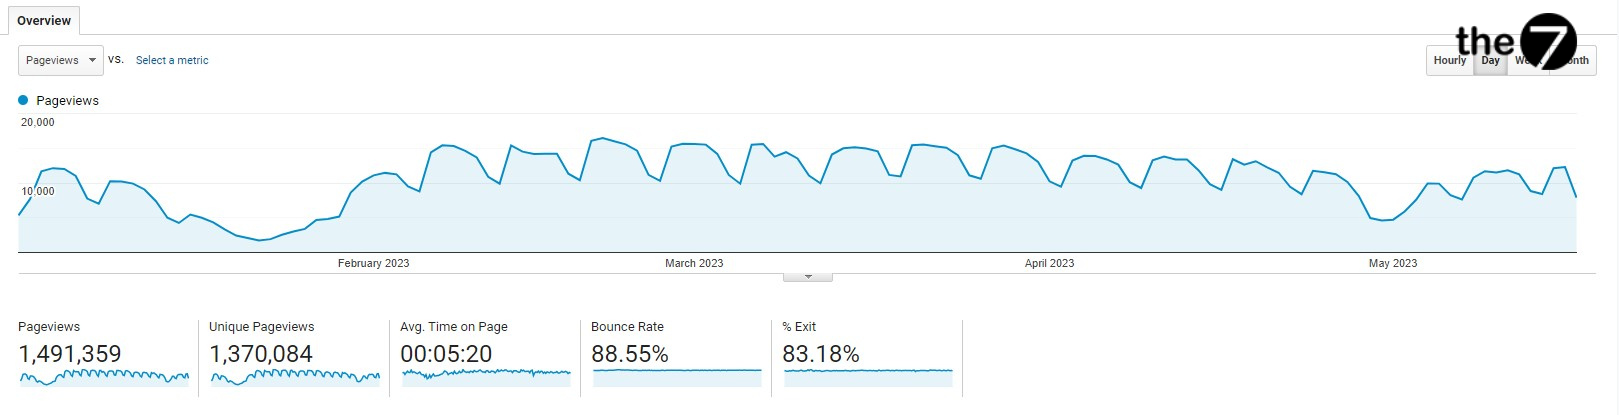
In website content marketing, pageviews are one of the most important metrics people watch. They tell you how many visits your website receives, each time a user stops by and takes in your content. Every time a specific page loads in a browser, whether for a returning or a new user, the pageview count goes up.
However, don’t rely too heavily on this number. Pageviews are only part of the story. To better understand content performance, you need to combine them with other metrics such as time on page, bounce rate, and especially conversion rate. Only then can you see the full picture of how your content is performing.
Users: take the pulse of your real fan base
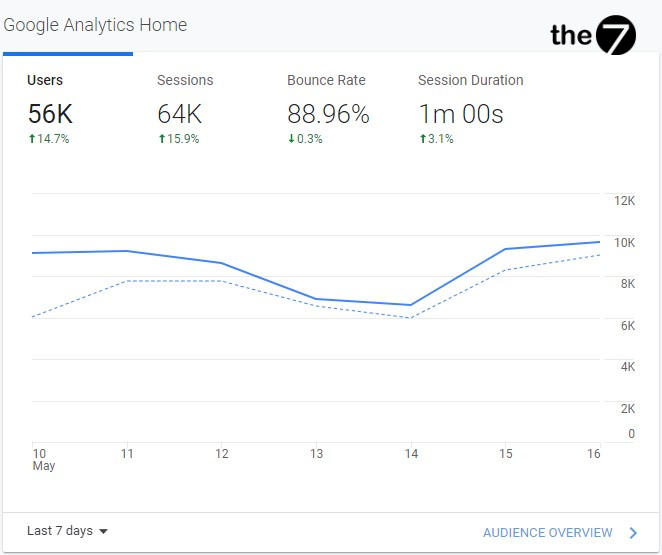
In Google Analytics, “users” is more than a simple number. It is the number of unique individuals who chose to visit your content “site.” Unlike pageviews, each user is counted only once, helping you better understand how many people are truly interested in your content.
Even better, you can segment users into two groups: new users and returning users. This information is the key to understanding how loyal your readers are and how effective your content performance campaigns are at attracting new users.
Sessions: follow your customers’ every step on your website
Every time someone visits your website, a “session” begins. A session can be seen as a series of user activities on your website, starting when they arrive and ending after a period of inactivity, usually 30 minutes.
Each user can have multiple sessions within a given period. For example, if a user reads one article on your website and then comes back a few hours later to read another, that counts as two separate sessions.
Tracking the number of sessions helps you better understand customer behavior on your website. You can see how many times they visit, what they do in each session, and whether they come back. This information helps you adjust your content and marketing strategy to deliver the best experience for customers and to optimize content performance as well as business results.
Pages Per Session: gauge how engaged your readers are
Pages Per Session is an average metric that shows how many pages each visitor views in one session. It is an important measure of how engaged readers are with the content on your website.
To raise this metric, you can turn your website into a “maze” of enticing information that invites readers to explore more pages. One effective approach is to use internal links wisely. By linking posts on related topics, you not only give readers more useful information but also encourage them to stay on your website longer and dive deeper into your world of content. This shows your content performance running at its full potential.

Impressions & Click-Through Rate (CTR): measuring search performance
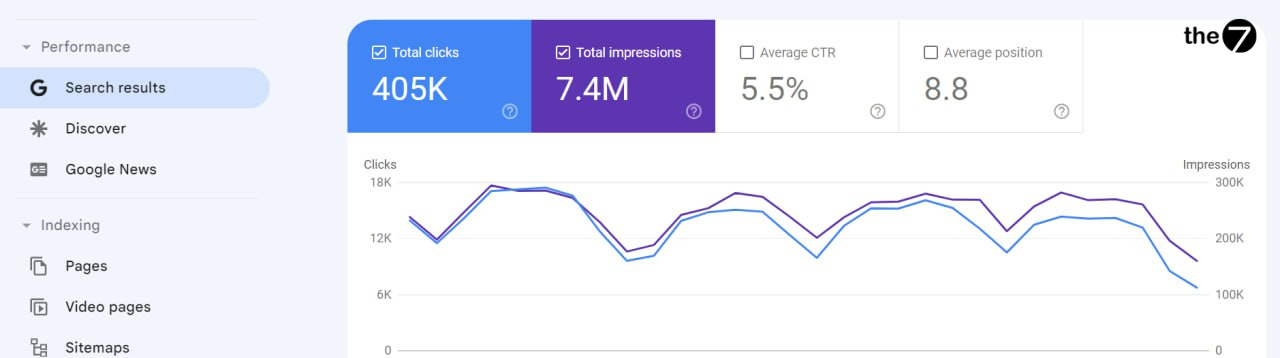
Impressions and CTR (click-through rate) are two indispensable metrics when evaluating content performance on search engines. Impressions show how many times your content has been displayed in front of users, while CTR reveals the percentage of users who were actually drawn in and clicked your link.
If you see high impressions but a low CTR, it suggests your content isn’t compelling enough to get users to click. Consider “refreshing” the title or meta description of the post to boost its appeal.
To track this important duo, you can use Google Search Console. It is a “powerful sidekick” that helps you better understand the search performance of your content and make the adjustments needed to optimize content performance.
Average position: the key metric for uncovering SEO potential
Average Position in search results is not just a number, but a key metric for SEO. For example, if your article sits at position 11 on page 2, that is a great opportunity to improve. Because 95% of users rarely go past the first page, climbing onto it can bring in a large amount of traffic and strengthen your brand. That is exactly why average position is not just a number, but an important guide for optimizing content performance as well as SEO.
Backlinks: the golden key to the top of the results
Backlinks are not just simple links; they are the key that unlocks the door to the top for your website. They are recognition, a credible “vote” from other websites for your content. The quantity and quality of backlinks are important factors Google uses to judge how trustworthy and valuable a website is. Backlinks from reputable sources not only improve your search rankings but also attract a large number of potential visitors. That is why backlinks are considered the “golden key” of your SEO strategy.
Keyword rankings: a measure of your content’s appeal
Keyword ranking is the position of a web page in the search results. It is not just a number, but also a measure of how well your content “fits the taste” of users and how “trustworthy” your website is in the eyes of search engines. If your content reflects what users are searching for, your keyword rankings will be higher. That means your page appears in a “prime spot” on the results page, drawing attention and engagement from users. This is why keyword ranking is not just a number, but an important indicator of your SEO performance and content performance.
Website Content Metrics
These metrics are a collection of key signals that website content creators pay special attention to. They tell you whether your content performance is delivering real value to users, and whether you are reaching the right target audience.
Average time on page
This is an important measure of the average amount of time users spend engaging with your content. It not only shows how engaging your content is, but also helps you better understand readers’ interests and behavior.
By analyzing the posts with the highest time on page, you can uncover the “recipe for success” behind them. It might be a vivid infographic, an engaging video, or a gripping story. You can then apply these elements to other posts to boost performance and create a more enjoyable reading experience for users.
Bounce rate
A high bounce rate can have many causes, from content that fails to meet user expectations to a poor user experience such as slow page loading or a cluttered layout. However, one important factor that is often overlooked is a missing or poorly optimized call to action (CTA).
A CTA is a “signpost” that points readers to their next action, such as reading another article, subscribing to a newsletter, or making a purchase. A missing or unappealing CTA can leave users feeling “lost” and make them leave the website quickly. This underscores the importance of a good CTA for optimizing the user experience and lowering your bounce rate.
Traffic sources
This is a tool that helps you analyze which traffic sources contribute the most to your website. They might come from the “giant” Google Search, or from “close friends” on social media. Or there may be a “secret channel” hiding in the background and contributing to your success.
By analyzing traffic sources, you will better understand user behavior and preferences, and so build more effective marketing strategies. For example, if most visitors come from social media, you can focus your ad campaigns on that platform to optimize content performance.
Social Media Metrics
Followers
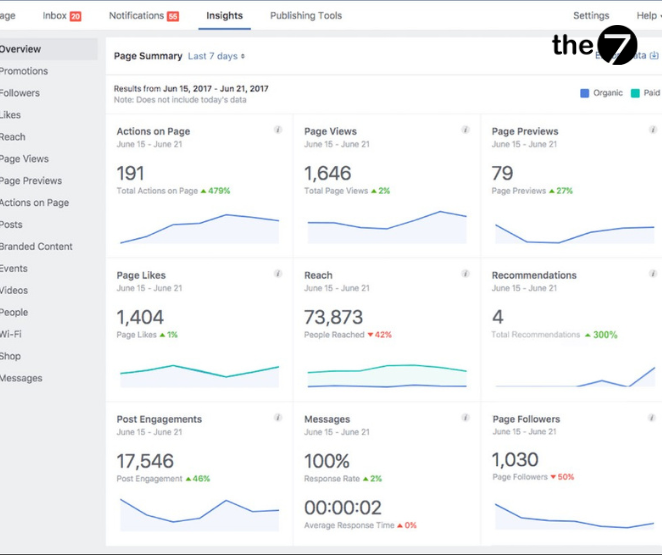
The more followers you have, the greater your chance to reach more customerswith no extra cost to you. This metric also shows how your community of users grows over time.
Likes and shares
These metrics show how much engagement and popularity the content you post is getting. A share is more meaningful than a like, because it not only proves your content performance is compelling but also expands your reach.
Comments
The number of comments under each post is a sign of higher engagement than likes and shares on social media. Users spend more time writing a comment than simply tapping the like or share button. This shows they care and want to discuss the content you share. Although it is easy to drop a “react” icon, sharing is a more deliberate decision.
Mentions
The number of mentions shows not only engagement but also the reputation of your brand. However, the value of a mention depends on the sentiment, the context, and the reputation of the person who wrote it.

In addition, for different content formats, it is also essential to define key performance indicators (KPIs) to measure after a campaign:
For video: Views, subscribers, likes, shares, comments, traffic sources…
For podcasts: Subscriptions, starts and streams, followers, listens, listener gender information…
Email Metrics
Open rate
This metric delivers a lot of valuable information: first and most importantly, about the relevance of the content you provide, and finally, about the subject line you use.
Click-through rate (CTR)
This is the percentage of recipients who clicked at least one link in your email out of the total number of emails sent. This metric reflects how engaging your email content is and how effective it is at nurturing leads, especially in the MOFU stage.
Click-to-open rate
The number of unique clicks relative to the number of unique opens. This metric gives you additional insight into whether your email message is truly useful to your readers.
Unsubscriptions
This metric shows the rate at which subscribers leave your email list. It helps you determine the optimal sending frequency so you don’t annoy readers, and also helps you segment your audience correctly.
>>> See more: Content Flops When It Lacks a Human Touch
Conclusion
Optimizing content performance helps you discover the perfect formula for boosting the effectiveness of your quality articles. Sometimes, content you consider excellent and high quality fails to attract your target customers and doesn’t hit the KPIs you set. That is why analyzing content data is a necessary step to master this formula. Remember these three mantras:
- Track, measure, and evaluate.
- Dare to test, dare to change.
- Optimize, optimize, and optimize.
By Thanh Thanh
Source: Marketing AI

Nguyễn Đình
Bảo




As CEO of The7, I am committed to sharing practical, useful knowledge with every reader. Every article on The7 is based on my 7 years of hands-on experience in marketing — Facebook advertising, LinkedIn advertising, Google advertising, and marketing strategy. I hope you take away plenty of insight from these posts and apply it successfully in practice.
Related Articles

Vu Lan Content Ideas That Win Customers’ Hearts
Vu Lan (Ullambana), a sacred and deeply humanistic festival in Vietnamese culture, is a time when every heart turns toward parents with profound gratitude. For brands, it’s a golden opportunity...

14 Highly Effective Content Marketing Writing Formulas
For content creators, mastering content writing formulas is essential to producing more engaging, high-value posts. Explore the 14 classic content writing formulas below and master the art of content creation....

The “Fat Cat” Trend: A Costly Lesson for McDonald’s Vietnam
Vietnamese social media has been abuzz in recent days over the tragic story of a Chinese young man nicknamed “Fat Cat” (Mèo Béo). Yet amid this wave of sympathy and...

5 AI-Driven Content Trends Taking Off in 2024
In the ever-changing world of marketing, innovation is the key to success. Staying ahead of trends and understanding customer needs are essential for any business that wants to claim a...

KUN Milk: Can It Break Through in Vietnam’s Dairy Market?
KUN Fresh Milk, the “offspring” of International Dairy Products Joint Stock Company (IDP) – owner of well-known dairy brands such as Love’in Farm, Ba Vi, and others – officially entered...

Why Content Flops Without a Human Touch: How to Breathe Life Into It
Today, content plays a key role in attracting customers and building a brand. But not every piece of content delivers the results you expect. There are many reasons content “flops”...