


How to Use Google Data Studio: The Latest 2024 Guide
Google Data Studio is a tool that helps advertisers analyze data, compile it into reports, and share those reports with clients and partners. In this article, The7 explains what Google Data Studio is and how to use it effectively.
What Is Google Data Studio?
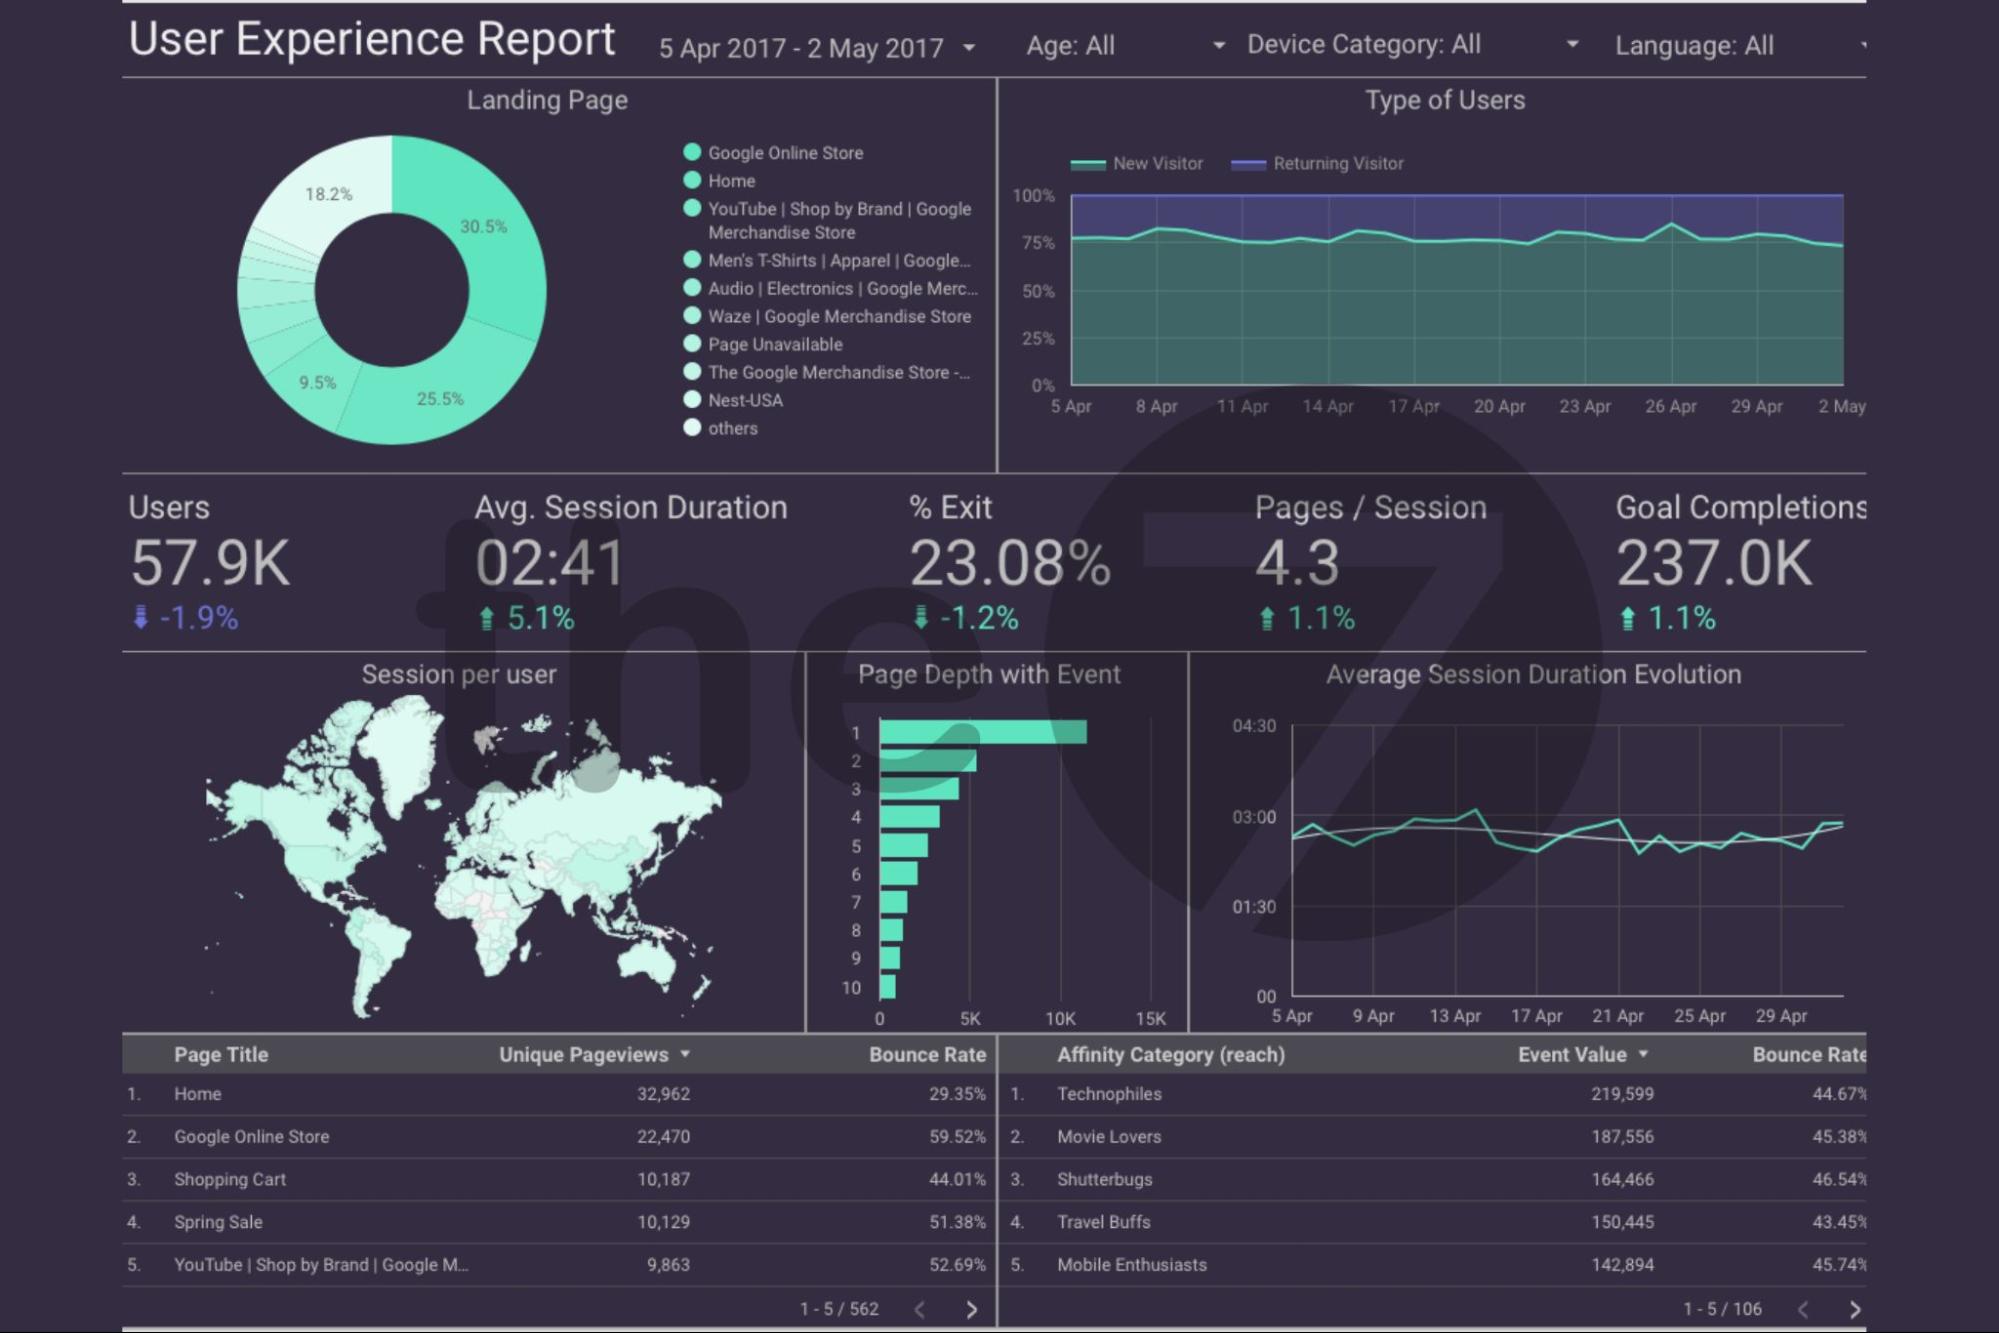
Google Data Studio is a tool that collects, analyzes, and visualizes data from many different sources (such as Google Analytics, Hotjar, Mixpanel…) in a single consolidated report. The report is presented through chart templates, tables, and visuals, making it easy for you to understand and track your data.
What’s more, Google Data Studio reports are updated in real time, so you always have the latest picture of your data.
With Google Data Studio, you can easily turn raw data from a spreadsheet into a clean, intuitive, great-looking report. You don’t need to know how to code, and it doesn’t take much time. All you have to do is open Google Data Studio, choose a suitable chart template, and connect your data to the fields in the chart.
>>>> See more: Google Adwords advertising services by The7
Who Is Google Data Studio For?
The answer: anyone who needs to analyze and present data can use it, and should. Because it integrates with countless data sources, from Facebook pixel and Google Analytics to a Google Sheets file or more advanced tools like Hotjar and Mixpanel, almost anyone can use Google Data Studio to present their data. In our experience, though, the following groups should definitely be using it:
- You run ads at an agency and need to report ad performance to clients.
- You work in a marketing/sales department and need to report your results to your bosses with numbers and charts.
- You build a tech product, app, or platform and need to monitor its “health.”
Benefits of Google Data Studio
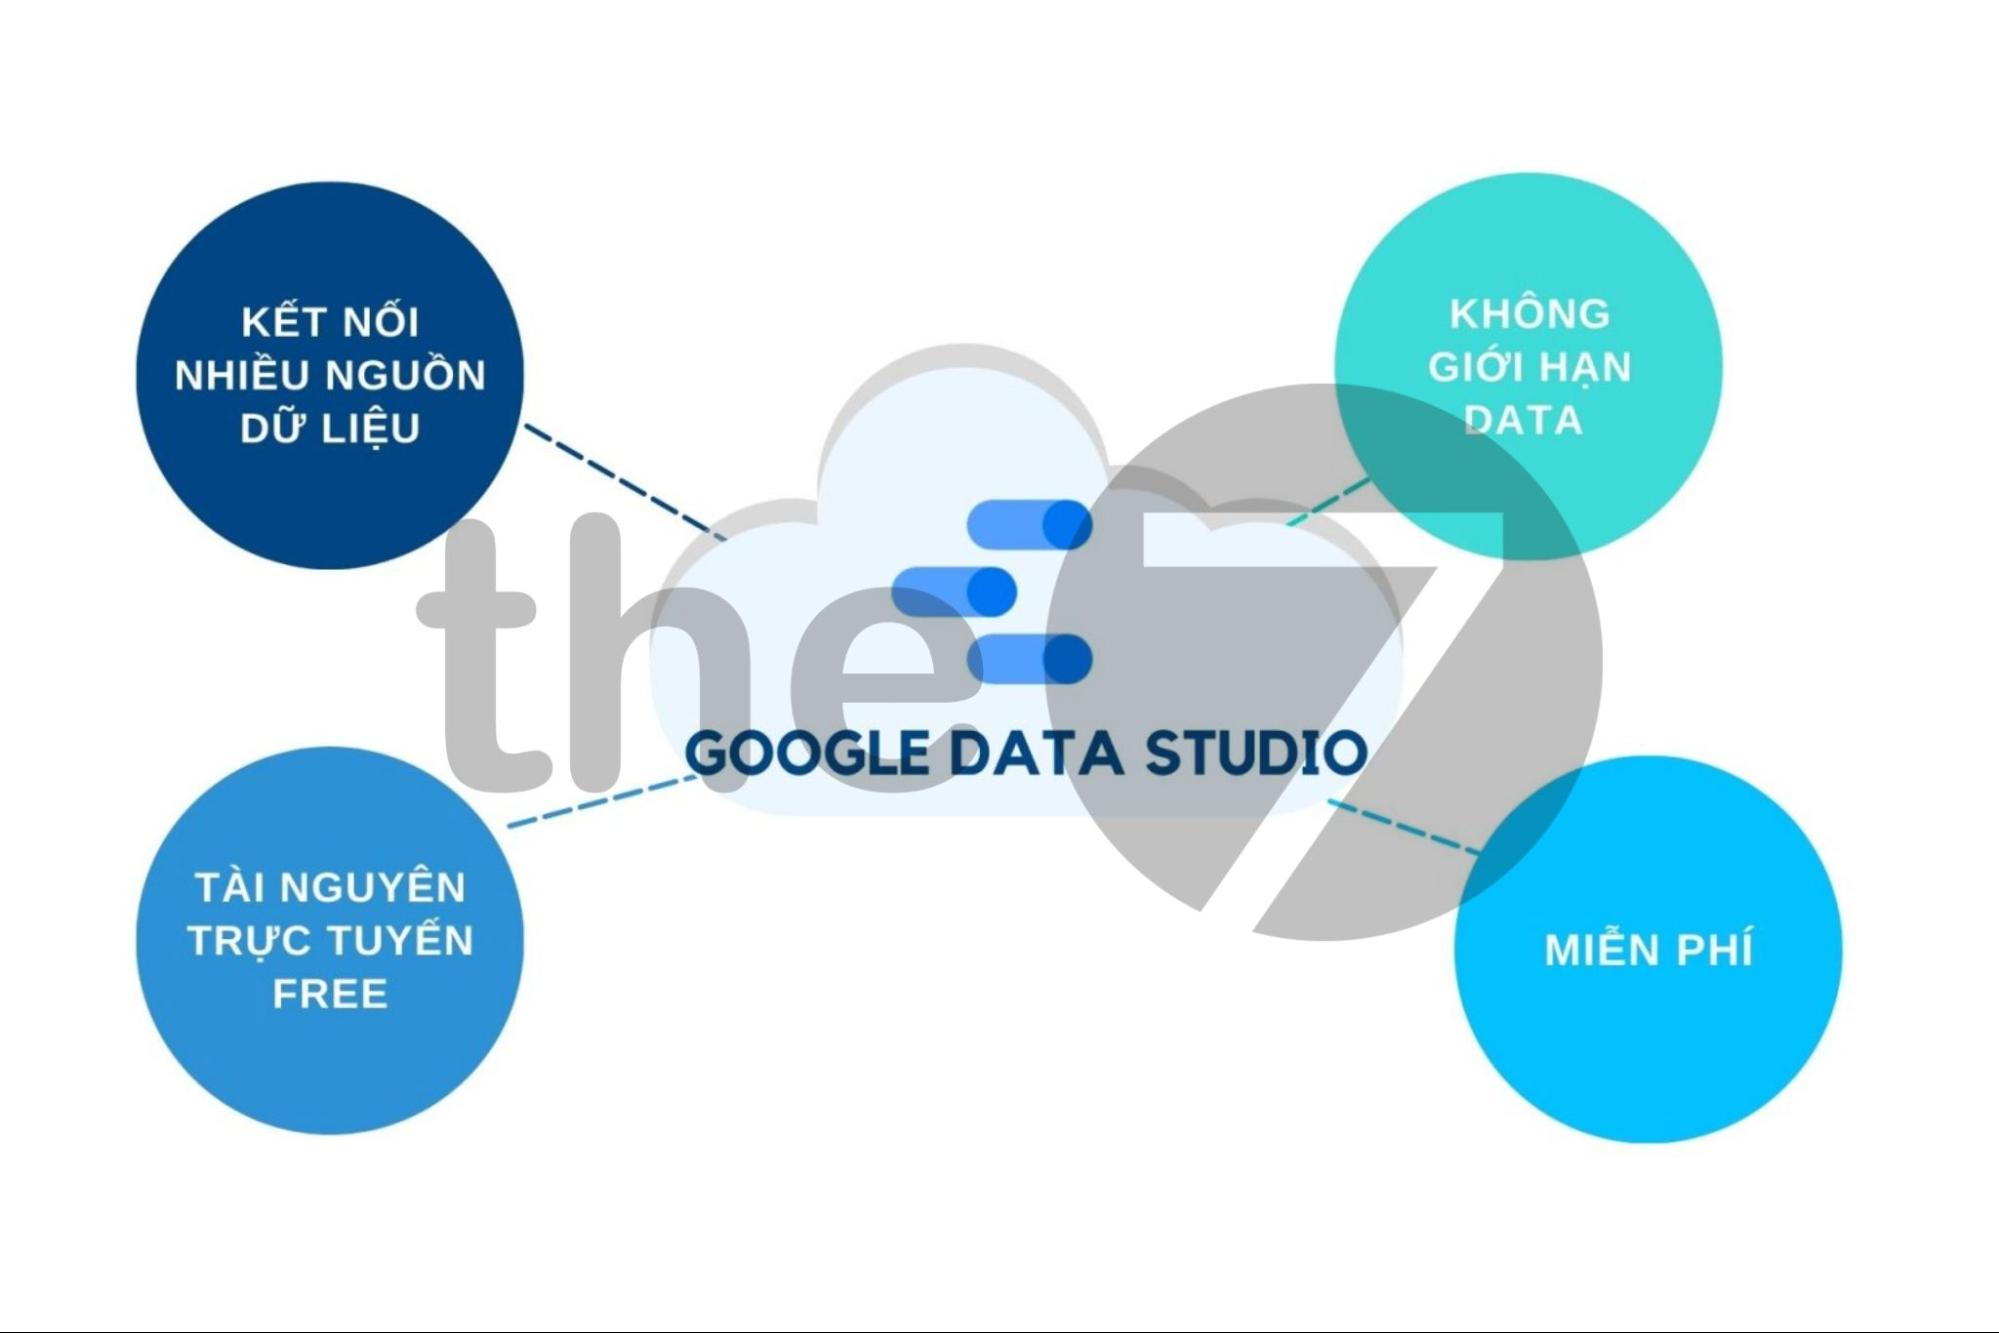
You use Google Data Studio to connect to the original data you want to present and set up a report template once, then use it for good, because the data in your report keeps updating for as long as the original data source stays connected to Google Data Studio.
Here are the advantages of Google Data Studio over other data visualization tools:
Real-Time Data Updates
If you have a metric for the number of visitors over the last 7 days, GDS automatically refreshes every day to update it with the latest data.
Easy, Unlimited Sharing
This is a huge advantage when you need to report regularly to clients or your boss. Instead of exporting a PDF or building PowerPoint slides and emailing them every week, you only need to set up Google Data Studio once and share it with the people who need to see it. New data flows into the report automatically, and viewers just choose the time period they want to look at. This tool is also great if you want to collaborate with someone else on building a report: with the right permissions, they can jump in and work on the report with you.
Unlimited Records, Pages, and Reports
This means you can use it completely free and without holding back. Creating reports for hundreds or even thousands of clients is no problem.
It’s a web-based dashboard platform, so you never have to worry about “Oh no, I closed it without saving.” All your settings and connected data are still there when you close the browser tab, with nothing to save.
Beautiful, Modern Report Design
GDS gives you plenty of options. You can freely drag and drop charts, figures, colors, text, and images to design a report exactly the way you want. It’s fully flexible to match the look you have in mind for your report.
Show Data From Every Channel in One Report
GDS lets you connect to countless data sources. You can pull data from Facebook, Instagram, Google Ads, MySQL, Mailchimp, Twitter, LinkedIn… anywhere you have data you want to bring into a GDS report.
Thousands of connectors are available for GDS, ready for you to pull in data and present it. This is especially valuable if you sell across multiple channels or run multichannel ads and want a single overview of every fluctuation on every channel.
How to Use Google Data Studio
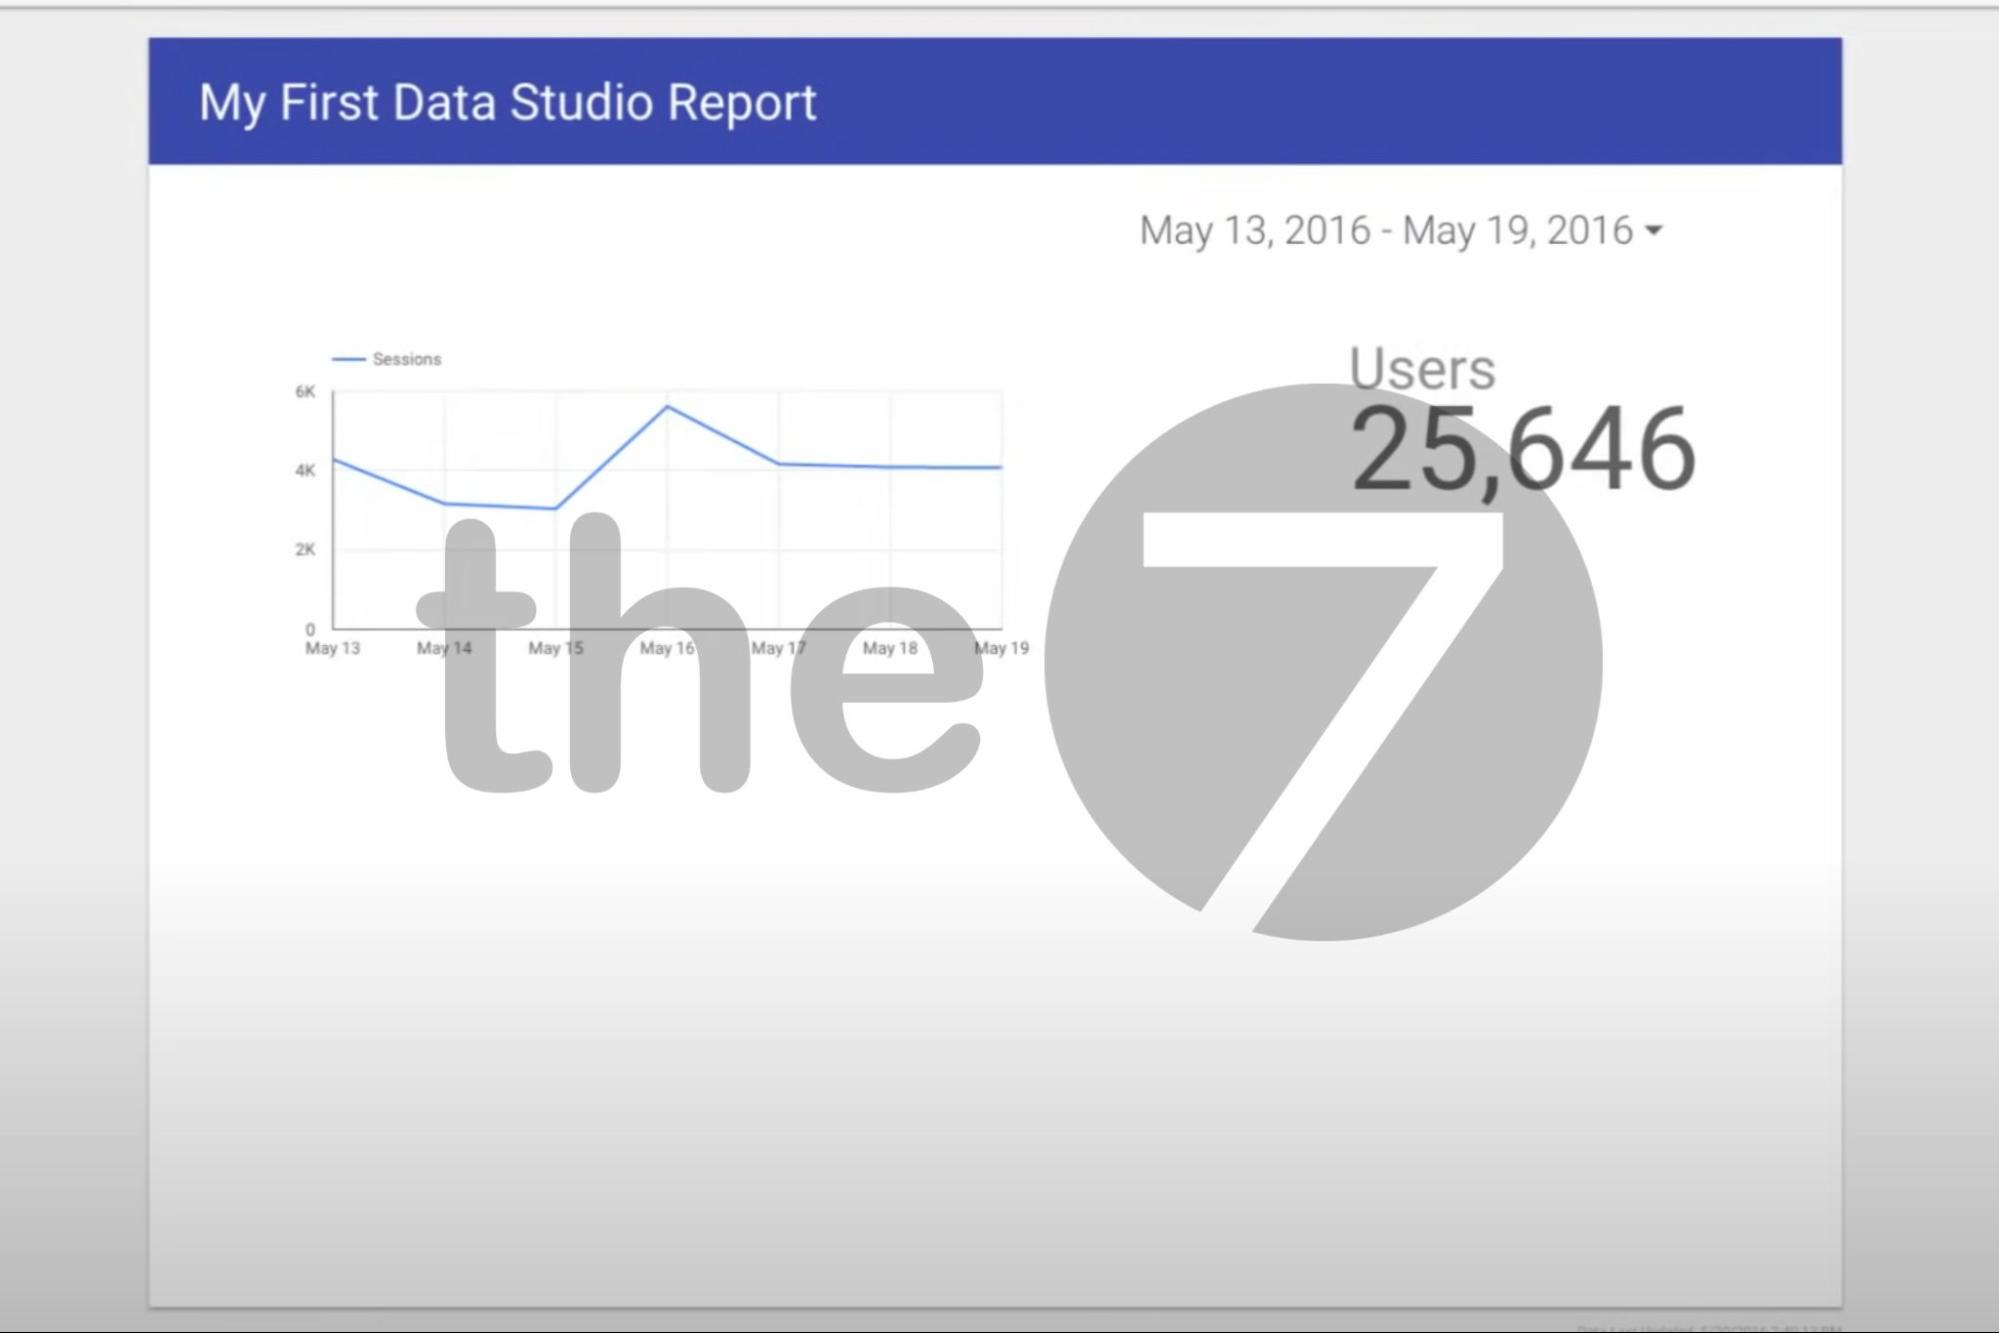
You can start using Google Data Studio in just 4 steps. Let’s follow along:
-
- Step 1: All you need is a Google account connected to the tools you want to analyze. Sign in at https://datastudio.google.com. There’s nothing to install.
- Step 2: Go to Start new report, or click the “+” button in the lower-left corner of the screen, to start creating a report.
- Step 3: Connect to your data source. At this step, you choose the data input you want to report on, such as Google Ads/ Facebook Ads/ Instagram Ads/ Mailchimp or your own database…. Whatever app or activity you’re using, there’s a 90% chance you can link its data to Google Data Studio.
- Step 4: After connecting your data, start dragging and dropping the charts you want to present and design the report’s look the way you like.
Introduction to Google Data Studio – Source: Google Analytics (YouTube)
How to Build a Google Data Studio Report for Google Ads
Here are examples of what a Google Ads performance report in Google Data Studio can include:
- Scorecards: key overview metrics, including total clicks, total amount spent, total conversions, and average cost per conversion
- An overview line chart showing all clicks/conversions from all ad campaigns over time
- A detailed table of running campaigns, with metrics for impressions, clicks, conversions, spend, and cost per conversion.
- A detailed table showing the performance of each campaign type.
- A keyword table (for Google Ads Search reports) with columns for clicks, conversions, and cost per conversion
- A placement table (for Google Ads Display Network (GDN) reports) with columns for impressions, clicks, conversions, and cost per conversion.
- A product table (for Google Ads Shopping reports) with columns for clicks, conversions, and cost per conversion.
- Demographic charts to understand your target customers.
- A bar chart of the ages of customers who click your ads and customers who convert.
- A pie chart of the gender split of customers who click your ads and customers who convert.
- A bar chart of the times of day/days of the week when the most people click your ads or convert.
- A bar chart of the top 5 geographic locations with the most clicks/conversions.
- A landing page report: a list of the landing pages you run ads to, with columns for impressions, clicks, and conversions. This table gives you more insight into which pages on your website attract the most converting customers.
- A search terms report (for advertisers who like to run Google Ads Search): a list of search queries with columns for impressions and conversions. This table gives you more ideas about which keywords will work well with your target customers.
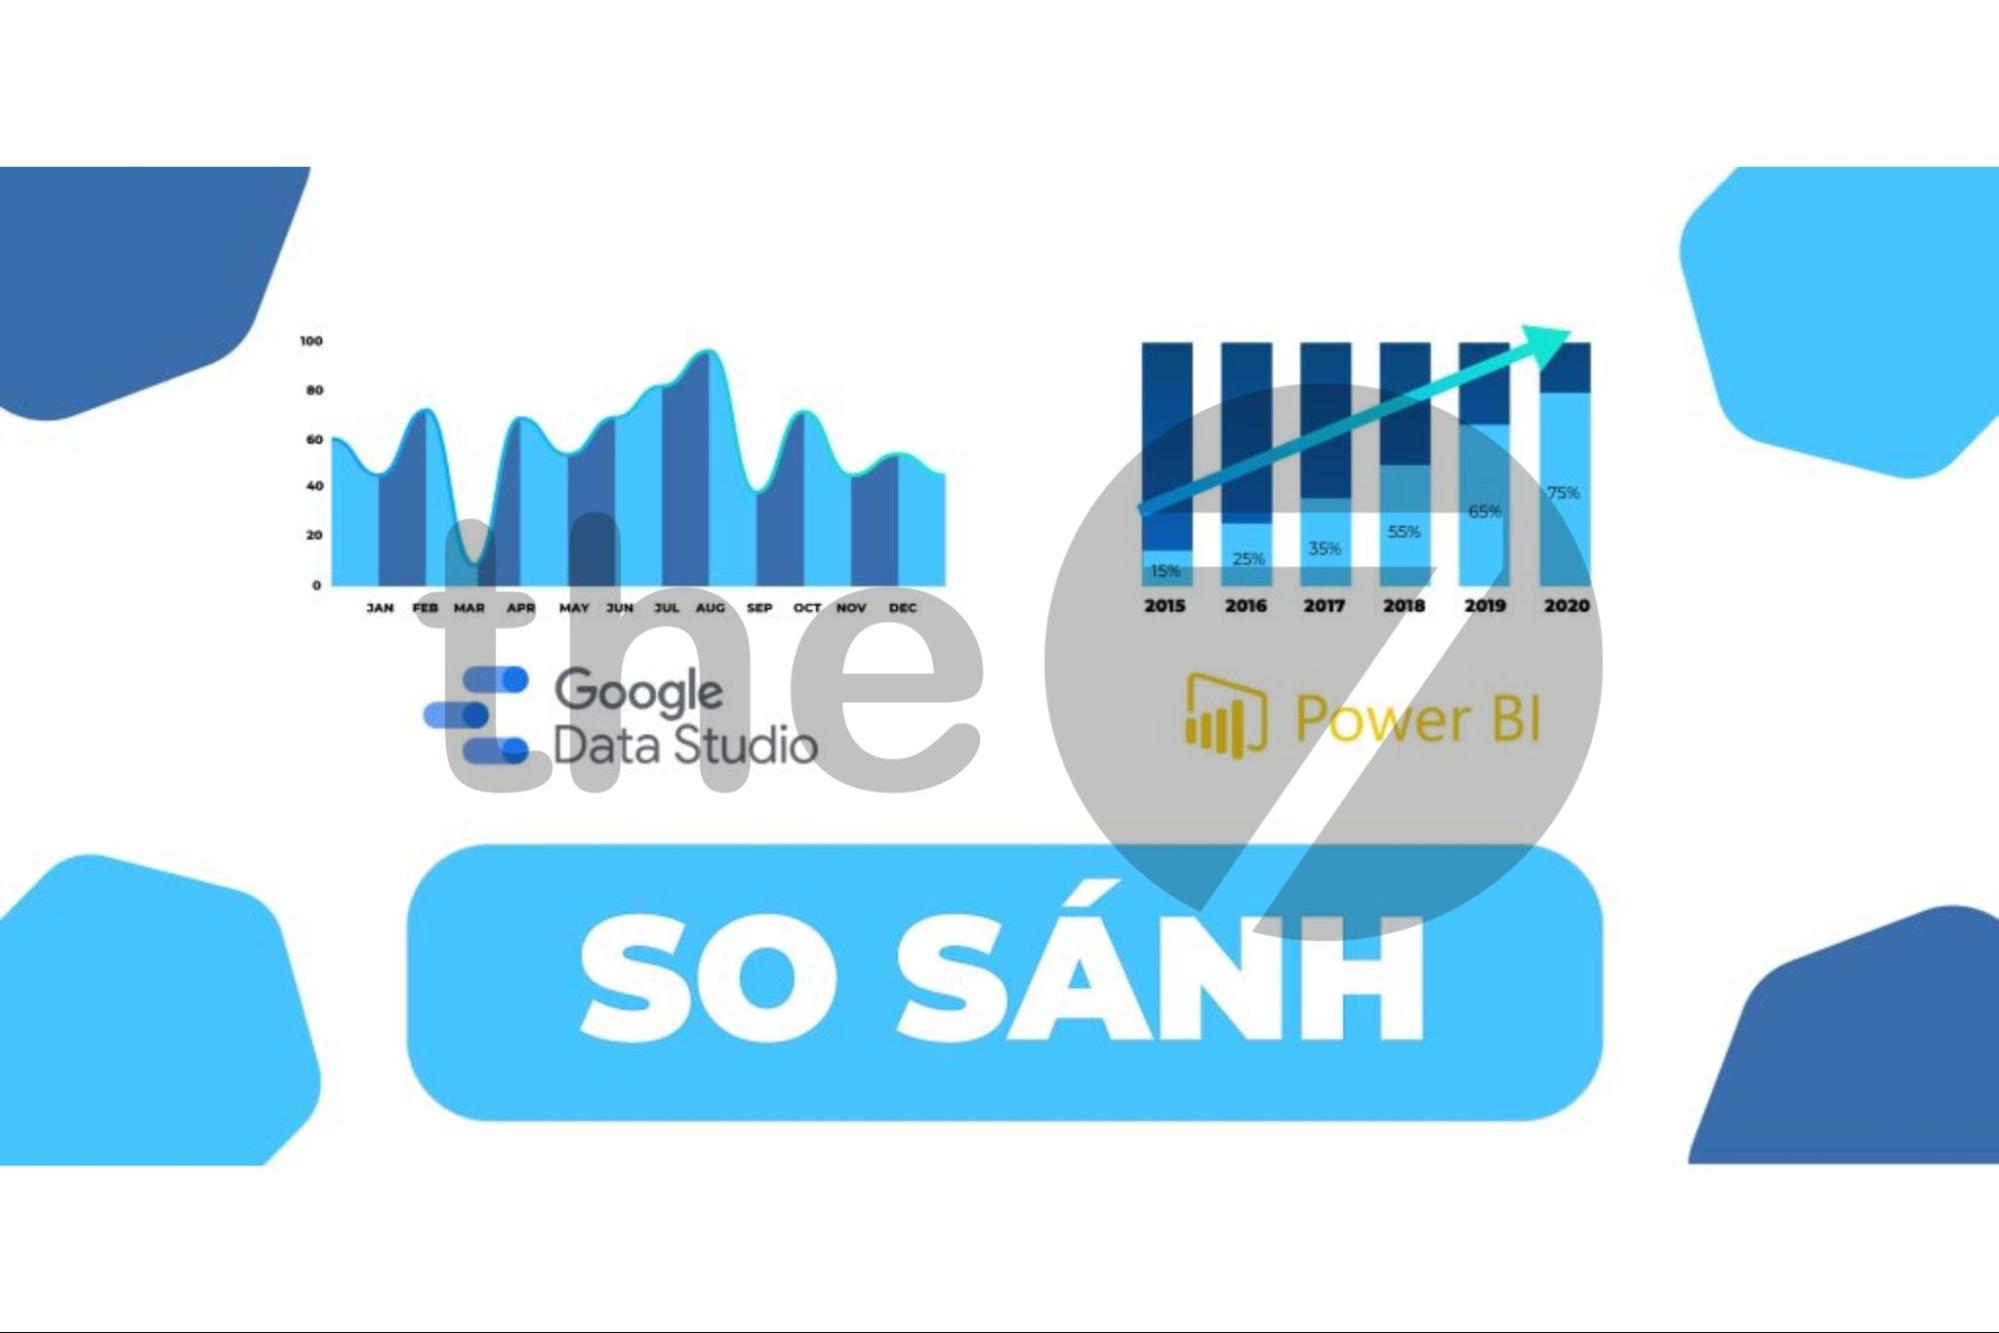
Google Data Studio vs. Power BI
Google Data Studio and Power BI are both extremely intuitive, easy-to-use reporting tools, but they differ in a few specific ways:
Cost
Google Data Studio is completely free, while Power BI charges a monthly fee. This is the biggest difference between the two tools.
Features
Both tools have intuitive interfaces that are easy to learn. However, Google Data Studio lets users share and connect reports and work with one another.
Setup Capabilities
Power BI lets users build reports on both computers and mobile phones. You can use it anywhere, which makes it easy for everyone to connect and share information.
Google Data Studio, meanwhile, lets users connect many different data sources: Word, Google BigQuery, Google Cloud SQL, Google Analytics, Google Sheets, and more. You can also share a report with just a link.
User Interface
The7 rates both tools as very easy to use, even for non-specialists. Google Data Studio and Power BI each have their own ecosystem, so you don’t need to worry about keeping data consistent across other tools.
That’s an overview of Google Data Studio, a useful data reporting tool, especially for anyone working in digital marketing. The tricky parts for beginners are probably still step 3 (connecting the data sources that feed your report) and step 4 (choosing metrics that are meaningful to analyze), and how you handle them will vary from case to case. The example above is a general Google Ads report; you can apply the same way of thinking to build reports for Facebook Ads and Instagram Ads.
>>>> See related articles:
- What Is Google Ads? Google Ads Knowledge for Beginners
- Tips for running effective Google advertising campaigns
- How to Write Google Adwords Ad Copy: The Most Detailed Guide for 2024
- What Is Google Merchant Center? The Latest on GMC in 2024

Nguyễn Đình
Bảo




As CEO of The7, I am committed to sharing practical, useful knowledge with every reader. Every article on The7 is based on my 7 years of hands-on experience in marketing — Facebook advertising, LinkedIn advertising, Google advertising, and marketing strategy. I hope you take away plenty of insight from these posts and apply it successfully in practice.
Related Articles

6 Simple Yet Effective Steps to Run Google Ads in 2024
Google Ads (Google AdWords) is Google’s online advertising service that helps businesses reach the right target customers, boost brand awareness, attract customers, and drive sales as customers search for information...
How to Run Effective Gmail Ads for Your Business
One of the advertising formats attracting the attention of many business owners is Gmail advertising. So how do you run effective Gmail ads? Let The7 walk you through this fresh...
What Are Google Smart Campaigns? Tips to Drive High Traffic
Google Smart Campaigns are one of the ways advertisers can access advertising information and digital marketing techniques faster. If you have just started a small business, keeping track of your...
What Card Should You Use to Pay for Google Ads in 2024?
Which card to use to pay for Google Ads is a common question among people who are new to Google Ads campaigns. So which card is best for paying for...

How to Link Google Analytics With Google Ads in 2024
To run Google Ads effectively, you need to do more than just launch campaigns. You also have to analyze and evaluate the performance of each campaign through its metrics. So...
How to Add Sitelink Extensions in Google Ads (2024 Guide)
Sitelink extensions let your ads give customers more information. They also make each ad stand out more than your competitors’ ads. This gives your Google Ads extensions a Quality Score...