Summary: Split a B2B marketing budget by job, not by channel: by default roughly 40% to demand creation, 30% to the loop and amplification and 30% to demand capture, and inside paid media, content first and the pitch later (7B Model book, chapter 5). In the 7B Model, budgeting is a question of three energy flows.
Open the marketing plan of many foreign B2B suppliers expanding into Southeast Asia and you will often find a single line called “ASEAN” or “APAC”. One number, one set of campaigns, half a dozen countries. It looks efficient. It is usually where the strategy quietly dies, because a single pool lets the ad platforms, not your plan, decide which country gets the money, and because that pool tends to chase people who are already searching.
Nobody decides to starve the long game; it happens one quarterly review at a time. This article is about splitting the money you already have: by operating layer, by energy flow and by market, with a reporting rhythm that survives a skeptical CFO.
Is your budget split by channel or by job?
Most B2B budgets are lists of channels: search, LinkedIn, trade shows, website, software, agency fees. That suits accounting, because invoices arrive by channel. It hides the only question that matters: what is each dollar doing for the machine?
Channels compete on the one thing they share, the number in the monthly report, and the channel that shows results in thirty days beats the one that needs three quarters. Paid media is already the biggest line: Gartner’s 2025 CMO Spend Survey put it at 30.6% of marketing budgets, or 2.4% of company revenue (Gartner, 2025). Nor are budgets growing to make room for anything slower. The 2026 edition found them effectively flat at 7.8% of revenue, while 56% of CMOs said they lack the budget their 2026 strategy requires (Gartner, 2026).
In the U.S., The CMO Survey (2026) shows the same tilt. Under pressure from the top, 70.6% of marketing leaders shift toward short-term impact over long-run gains, and acquisition spending now runs 26% above retention spending, even as retention outperforms acquisition in the survey’s own performance data (The CMO Survey, 2026).
Splitting by job looks different. A B2B machine does three jobs: it makes people who are not yet looking know you exist, it gets customers, partners and AI to speak for you, and it is there when buyers start researching. The 7B Model calls these demand creation, amplification and demand capture.
One channel can do all three. LinkedIn can carry an engineer’s analysis to managers who have never heard of you, then remind a visitor of a case study after they view your pricing page. A channel is a pipe, not a destination. My piece on paid advertising in B2B explains why ads are a layer over many gears; this one answers how much each job should get.
Why does demand capture hit its ceiling sooner than demand creation?
Search ads can only serve people who already typed the query, and how many people search for industrial air compressors this month is set by the market, not by your budget. Double the spend and you do not double the searchers; you pay more to meet the same people, in the same auction, against the same rivals. Retargeting has the same limit: it only reminds people who already came by.
That is the ceiling. Its root is the 95/5 rule, which I explain in that article and will not repeat here. On a spreadsheet, the consequence is simple: every extra dollar pushed into capture buys less than the dollar before it.
Demand creation has a ceiling too, but a much higher one. It targets the much larger group of people who are not looking yet, and its money buys memory rather than an existing search. When those buyers finally go looking, they type your name, and the mental availability you built has done the bidding for you.
The catch is time. In Dreamdata’s 2026 benchmarks, built on its customers’ data, the average path from first LinkedIn ad impression to closed revenue took 281 days (Dreamdata, 2026). A quarterly report will always show creation as a loss. And when the revenue finally lands, it may walk in through a branded search or a direct visit, so capture takes the credit.
Effectiveness research points the same way. Two of the five principles that Les Binet and Peter Field drew up for LinkedIn’s B2B Institute are to invest in share of voice and to balance brand and activation (IPA, 2025). Balance, not abandonment. The 7B Model does not ask you to drop capture, only to stop letting it eat most of your resources, a trap I also describe in brand marketing vs performance marketing.
What does 40/30/30 look like on a spreadsheet?
In the book I call it the common split: about 80% of resources on buyers already in market (7B Model book, chapter 5). A 7B machine leans the other way, by default about 40% to demand creation, 30% to the loop and amplification and 30% to demand capture (7B Model book, chapter 5). The word “about” is honest: it is my working rule, not an industry standard. The exact split moves with your stage, your industry and your means; the direction does not.
The split covers resources, not just ad money: cash, people and hours. The book estimates the whole machine needs 25 to 30 hours of team time a week (7B Model book, chapter 13), which is why a company with no ad budget can still run 40/30/30 on expert time.
Draw three columns before you place a single channel, and make every line say which layer it serves and which signal will judge it. The signals below follow the book’s four measurement columns (7B Model book, chapter 14):
| Layer | Gears | Where money and hours go | Signal to watch |
|---|---|---|---|
| Demand creation | Broadcast, Buzz | expert content, engineer videos, paid amplification of that content, trade media, podcasts | branded search trend, share of the right audience |
| Amplification | Backing, Bridge | customer stories, reviews on industry platforms, referral programs, partners, customer events | deals whose buyers say they came through content or a referral |
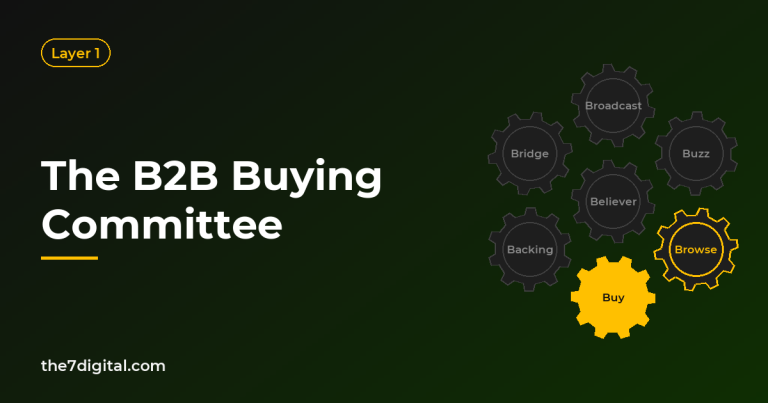
| Demand capture | Browse, Buy | search ads, retargeting, website, demos, material for each seat on the buying committee | readiness across the six gateways, win rate, revenue |
| Connecting loop | Believer | onboarding and service after the sale | new case studies, reviews, referrals, retention |
Two things happen once the columns exist. One channel can sit in two of them with two yardsticks, so nobody asks a content amplification campaign to prove itself with form fills. And an empty column shows at once. Many B2B budgets I review have almost nothing under amplification, which means the Backing and Bridge gears are turning on luck.
Then adjust for your starting point. The book gives a company just starting out a 50/20/30 split, and a known brand with weak deals 30/30/40, in the same order of creation, loop and amplification, capture (7B Model book, chapter 5). Who owns each column matters as much as what sits in it, which is why the 7B Gear Captain Matrix in building a B2B marketing team gives every gear a named owner.
How do the three energy flows feed each gear?
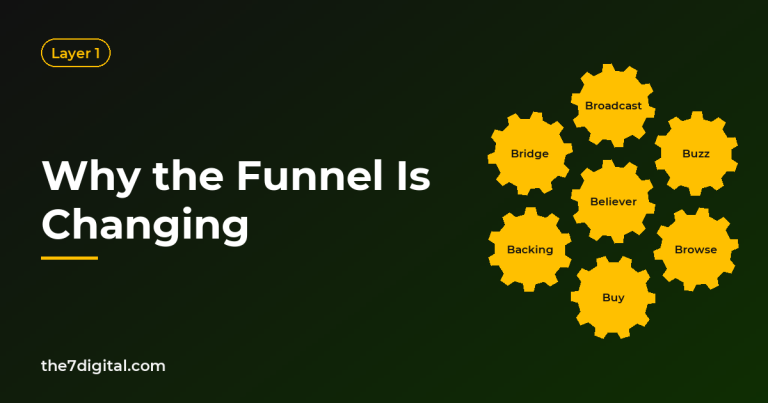
Every gear needs energy to turn, and that energy comes from three flows. Paid is money that carries content to the right people. Owned is everything on your own ground (website, YouTube channel, newsletter, technical library) that no algorithm can take away. Earned-and-shared is what other people do for you: they mention you, forward you, defend you, and you pay them nothing.
Each gear runs on its own mix (7B Model book, chapter 5). Broadcast starts on owned and paid, and earned takes over more of the work as the content gets sharper. Buzz has no buy button, because real resonance only comes from earned. Browse needs owned and paid on duty together, so buyers find you whenever they look. Buy and Believer run mostly on what you make yourself: material for each seat at the table, and the experience after signature. Backing and Bridge belong to earned. Others speak for you, then bring others in.
Money is the only flow that stops the day you stop paying. Owned accumulates and earned multiplies, so use paid to prime the other two, not to replace them.
Inside paid, the book’s rule is content first and the pitch later, leaning toward demand creation (7B Model book, chapter 5). The key word is content. The money that goes first does not haul sales pitches around the market. It carries an analysis, an engineering video or a case study to the right people by title, industry and company size, people who are not buying yet but will remember who taught them something useful. The share for Browse waits at the door for the moment they start to look.
The ratio is not fixed for life. As earned grows, content travels further on its own and Broadcast needs less paid support: the machine is starting to turn itself.
Intel: Paying partners to say your name
The classic case of paid energy priming partner energy is Intel. According to Intel’s own history pages, the Intel Inside campaign launched officially in 1991 and leaned on a cooperative program in which Intel subsidized PC makers (OEMs) that put the logo on their own products and ads. According to Intel, by the end of 1992 more than 500 OEMs had signed on, and 70% of OEM ads that could carry the logo did so.
The $250 million initial investment was unprecedented and drew skeptics, yet by the late 1990s Advertising Age called Intel Inside the most effective co-op advertising program in history (Intel, n.d.).
Read through the 7B Model, Intel bought no clicks. It used paid energy to buy a place inside its partners’ advertising: every PC maker’s ad became an Intel Broadcast aimed at people who never buy chips directly, and the partners were the Bridge that carried the name. You do not need $250 million to borrow the design. Before you fund your own channels, ask which partners already talk to your buyers every day, and co-fund your presence in those conversations.
How do you split ad spend across several countries?
Selling across borders adds a dimension to the budget: geography. In Google Ads, budget, language and location are campaign-level settings, and Google’s help pages point to separate campaigns when you want to run ads in different locations or with different budgets (Google Ads Help, n.d.). Pool several countries in one campaign and you let the platform, not your strategy, decide where the money goes.
I split in three steps. First, give each market a role before giving it money: seeding, where nobody knows you yet; sprouting, where the first customers have signed; fruiting, where your name already carries weight. The roles mirror the book’s stage adjustment, leaning toward creation where you are new and toward capture where the brand is strong but deals are weak (7B Model book, chapter 5). A 7B Market X-Ray shows which gears turn and which stick in each country before you commit.
Second, keep content first inside each market, but let local data choose the channels that carry it. Video reach alone varies more than most regional plans assume. Google’s advertising data, as compiled by DataReportal (2025), put YouTube’s ad reach in late 2025 at 90.6% of the population in Singapore, 65.9% in Thailand, 65.4% in Malaysia, 52.7% in Indonesia and 50.9% in the Philippines. LinkedIn reach swings even harder across the region, as my piece on LinkedIn Ads for cross-border B2B shows, so where LinkedIn is thin, video and search carry more of the load.
Third, compare within countries, not across them. A click in Singapore and a click in Jakarta neither cost nor mean the same; compare each country’s trend on the four signals below over at least twelve months. Which content stays global and which gets rebuilt locally is the question in standardize or localize.
Huawei: In Europe, the budget flows through partners
One line foreign suppliers tend to forget is money for the amplification layer in the host market. At its European Partner Conference 2026 in Como, Italy, Huawei said European partners contributed over 90% of its enterprise revenue, with service delivery and implementation now almost entirely partner-led (Huawei, via PR Newswire, 2026). The company said it works with more than 5,000 partners in Europe and would train over 10,000 certified engineers, put more than $20 million into marketing and open over 90% of its product services to partners (Huawei, 2026).
These are Huawei’s own figures, but the direction of spend is plain. Far from home, amplification money flows to the people already standing next to the customer: Bridge and Backing with a proper budget line, not left to goodwill. In a new country, that column should hold partner training, co-branded material and joint advertising with distributors, not only case studies.
What should you report instead of clicks, and how long until it pays?
The CFO’s question, how many customers this money brings in, is fair. The trouble is answering it with clicks. The book proposes four replacement signals (7B Model book, chapter 14):
- Branded search volume, because people who type your name already know you exist.
- What buyers write when a form or first call asks “How did you hear about us?”, with no options to pick from.
- Engagement quality: the right people, not many people.
- The content buyers touched before the deals you closed.
Each signal lights up a layer. Branded search shows whether creation is seeding memory. Self-reported answers reveal amplification your software never sees, such as a colleague’s forward or a partner’s introduction. Engagement quality and pre-deal content show whether capture meets the right buyers. Report all four per country.
Then agree on time before you spend. The book’s rhythm is three months of seeding, six months to see sprouts and twelve months to see fruit, with the machine starting to accelerate itself between months twelve and twenty-four (7B Model book, chapter 5). Approve budgets annually but judge them quarterly, and creation gets cut just before it sprouts. The book’s cadence is the tidiest I know: fifteen minutes a week on content output, thirty minutes a month on the four-column board, two hours a quarter to re-diagnose all seven gears (7B Model book, chapter 13). Reallocate at the quarterly session, never because a cost per click ticked up.
Once budgets are large and your history is long, you can measure impact at budget level with a statistical model instead of tracing clicks. That is the subject of marketing mix modeling for B2B.
Where does the B2B marketing budget fit in the 7B Model?
A budget belongs to no single gear. It is the fuel of the whole machine, and the 7B Model describes that fuel as the three energy flows: Paid, owned, earned-and-shared. Money buys the first, helps build the second and can only prime the third.
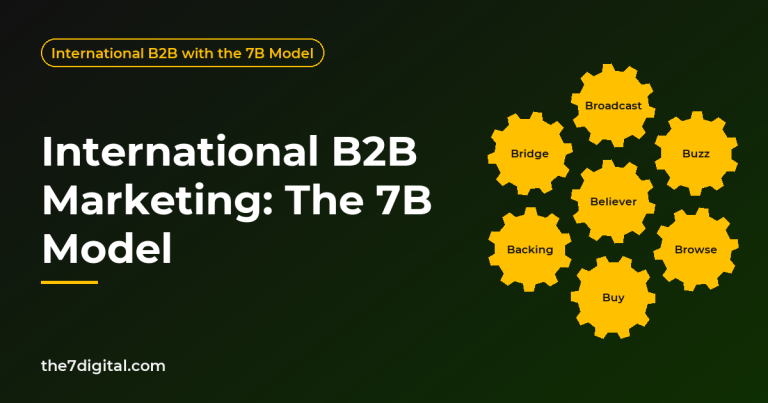
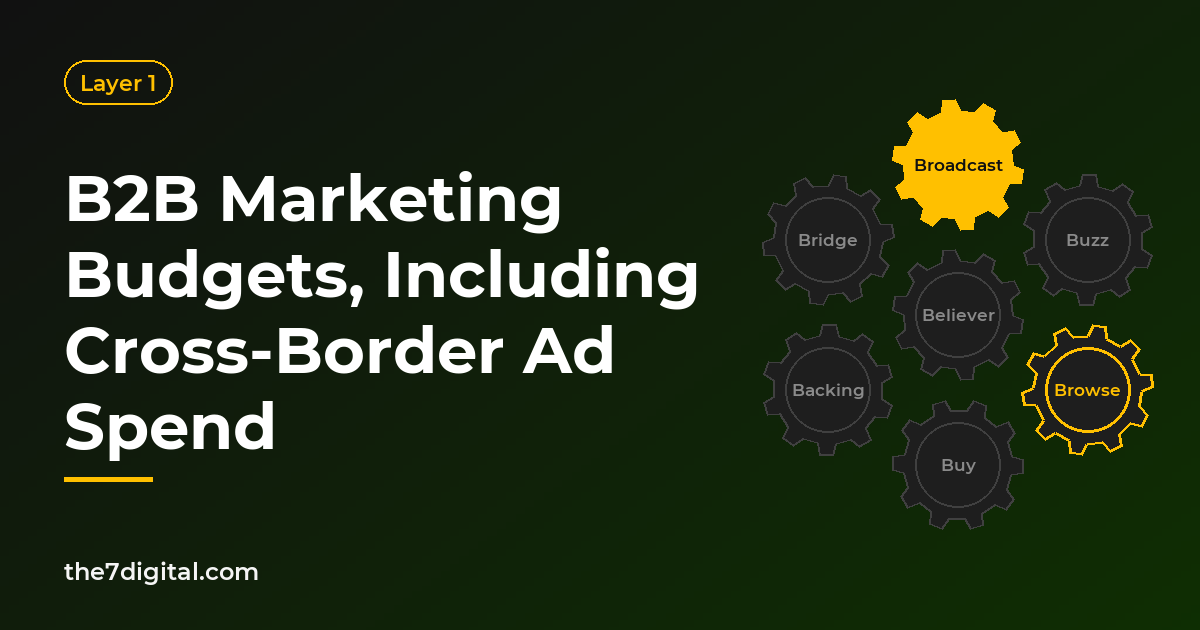
Those flows run through the three operating layers: Demand creation (Broadcast, Buzz), amplification (Backing, Bridge), demand capture (Browse, Buy); Believer is the connecting loop. The starting-point split (40/30/30 by default) divides resources across the layers, while the paid flow follows one rule, content first and pitch later (7B Model book, chapter 5). They answer different questions, so never merge them into one number.
The model’s two operating principles double as budget rules. Customers can enter anywhere, so no layer goes to zero. One stuck gear slows the whole flywheel, so the line most worth raising is usually the one feeding the stuck gear, not the one with the prettiest report. The 7B Market X-Ray finds the stuck gear in each country, the 7B Gear Captain Matrix names an owner for each line, and the One-Page 7B Strategy, the next piece in this series, gives resources their own corner of the page: budget in percentages, hours by role. New to the gears? Start with the 7B Model.
The 7B Model was developed by Nguyen Dinh Bao (Bao7) at The7 Digital and is set out in full in the book Mô hình 7B cho B2B (Stop Begging, Start 7B).
Selling B2B into Vietnam and ASEAN
Vietnam deserves its own budget line, not a slice of an ASEAN pool. The economy expanded by an estimated 9.01% from January to September 2026 compared with a year earlier, and close to 149,700 enterprises were newly registered in those nine months (National Statistics Office of Vietnam, 2026). New companies and new plants form buying committees that have never heard of you, which makes Vietnam a demand creation job before it is a capture job.
You will also be up against suppliers buyers already know. China was Vietnam’s largest source of imports in 2025, at US$186.0 billion (National Statistics Office of Vietnam, 2026). A capture-only budget asks a buyer to switch from a familiar source on the strength of an ad. A creation budget gives them reasons to put you on the shortlist before the request for quotation goes out.
Inside Vietnam, that rule points to specific channels. Browse runs through Google, which held 93.38% of the country’s search engine market in October 2026 (StatCounter, 2026). For the content that goes first, reach differs sharply by platform: in late 2025, Facebook’s ad reach equaled 77.6% of Vietnam’s population and YouTube’s 61.0%, while LinkedIn’s ads reached 13.5% of adults (DataReportal, 2025). LinkedIn finds titles. Facebook and YouTube reach the owners, engineers and plant managers who sit on the same committee.
Retargeting and customer lists need a consent plan. Since January 1, 2026, Vietnam’s Law on Personal Data Protection has given data subjects six core rights, among them the right to give, refuse or withdraw consent (Viet Nam News, 2026). Fund the owned assets people choose to join, such as a Vietnamese-language newsletter or a webinar series, so that your Browse money works on audiences who agreed to hear from you.
Across ASEAN, run one budget per country and expect a different mix in each, as the YouTube figures above show. Keep the starting-point logic everywhere, and put real money behind partners where you are farthest from the customer. A respected distributor in Ho Chi Minh City or Jakarta is a Bridge you can budget for.
Conclusion: Ask what the money does, not where it goes
B2B marketing budgets rarely fail because the number is small. They fail because they are split in invoice order, not machine order. When every line is a channel, the easiest channel to report eats the most, and the seeding layer starves quietly.
Split by job and the spreadsheet changes shape: about 40/30/30 by default across creation, loop and amplification, and capture, and content before the pitch inside paid media. Across borders, every country gets its own budget, role and channel mix, and is judged on four signals over twelve months rather than clicks over thirty days.
The CFO’s question still stands. The answer just does not live in a channel. Money does not buy customers. It buys energy, and the machine turns energy into customers.
For the mechanics of ads as a layer over the gears, read paid advertising in B2B. For budget-level measurement once your data runs deep enough, see marketing mix modeling for B2B. And if you sell into several countries, the next piece in this series, the One-Page 7B Strategy, puts every number here on a single page per market, while the series pillar on international B2B marketing maps the whole journey.
Frequently asked questions
What percentage of revenue should a B2B company spend on marketing?
There is no universal number. Gartner’s 2026 survey puts the average at 7.8% of revenue, but most respondents report annual revenue above $1 billion, and The CMO Survey (2026) reports 9.0% for U.S. companies. The samples differ, so start from the three jobs and your real resources, then sanity-check against the averages.
Does 40/30/30 work for a small company?
Yes, because it splits resources, not only ad money. The book is explicit that the machine still runs with zero ad budget: owned content, organic distribution, dark social and referrals still create deals, and paid is an accelerator (7B Model book, chapter 5). Small teams lower the frequency but keep the rhythm.
Should I cut search ads to fund content?
No. By default, capture still gets about 30% of resources, and Browse keeps paid presence for when buyers search (7B Model book, chapter 5). What you stop is the habit of pouring nearly everything there. When creation works, search has an easier job, because more of the people searching already know you.
How should I split ad spend across ASEAN countries?
Not equally, and not in one pool. Give each country a role and its own campaigns and budget, keep the content-first rule inside each one, choose channels from local data, and compare each country with itself over at least twelve months.
One team running LinkedIn, YouTube, Google Search and retargeting as one machine, reported with four signals instead of clicks. Book a 7B X-ray.
International B2B with the 7B Model · Part 23 of 24 · Previous: Standardize or Localize? · Next: The One-Page 7B Strategy · Pillar article: International B2B Marketing: The 7B Model
References
- Gartner (2026). Gartner 2026 CMO Spend Survey Finds CMOs Allocate 15.3% of Marketing Budgets to AI But Only 30% Are Ready to Scale AI Capabilities. https://www.gartner.com/en/newsroom/press-releases/2026-05-11-gartner-2026-cmo-spend-survey-finds-cmos-allocate-15-point-3-percent-of-marketing-budgets-to-ai-but-only-30-percent-are-ready-to-scale-ai-capabilities
- Gartner (2025). Gartner 2025 CMO Spend Survey Reveals Marketing Budgets Have Flatlined at 7.7% of Overall Company Revenue. https://www.gartner.com/en/newsroom/press-releases/2025-05-12-gartner-2025-cmo-spend-survey-reveals-marketing-budgets-have-flatlined-at-seven-percent-of-overall-company-revenue
- Moorman, C., The CMO Survey (2026). Marketing Contracts Under Economic Pressure Despite Growing Value and AI Gains. https://cmosurvey.org/marketing-contracts-under-economic-pressure-despite-growing-value-and-ai-gains/
- Dreamdata (2026). Announcing The 2026 LinkedIn Ads Benchmarks Report by Dreamdata. https://dreamdata.io/blog/announcing-linkedin-ads-benchmarks-report-2026
- IPA (2025). Five Principles of Growth in B2B Marketing (report by Peter Field and Les Binet for LinkedIn’s B2B Institute). https://ipa.co.uk/effworks/marketing-marketing-v2/five-principles-of-growth-in-b2b-marketing/
- Intel (n.d.). Ingredient Branding: Intel Inside (Intel history, virtual vault). https://www.intel.com/content/www/us/en/history/virtual-vault/articles/end-user-marketing-intel-inside.html
- Huawei (2026). Huawei Strengthens Partner-Centric Strategy to Drive Enterprise Growth in Europe (PR Newswire release, republished by Bolsamania). https://www.bolsamania.com/nota-de-prensa/mercados/huawei-strengthens-partner-centric-strategy-to-drive-enterprise-growth-in-europe–22308702.html
- Google (n.d.). Campaign: Definition, Google Ads Help. https://support.google.com/google-ads/answer/6304?hl=en
- DataReportal (2025). Digital 2026: Singapore. https://datareportal.com/reports/digital-2026-singapore
- DataReportal (2025). Digital 2026: Thailand. https://datareportal.com/reports/digital-2026-thailand
- DataReportal (2025). Digital 2026: Malaysia. https://datareportal.com/reports/digital-2026-malaysia
- DataReportal (2025). Digital 2026: Indonesia. https://datareportal.com/reports/digital-2026-indonesia
- DataReportal (2025). Digital 2026: The Philippines. https://datareportal.com/reports/digital-2026-philippines
- DataReportal (2025). Digital 2026: Vietnam. https://datareportal.com/reports/digital-2026-vietnam
- StatCounter (2026). Search Engine Market Share in Viet Nam, October 2026. https://gs.statcounter.com/search-engine-market-share/all/viet-nam
- National Statistics Office of Vietnam (2026). Some highlights of the socio-economic situation in the third quarter and nine months of 2026 (in Vietnamese). https://www.nso.gov.vn/bai-top/2026/10/mot-so-net-chinh-tinh-hinh-kinh-te-xa-hoi-quy-iii-va-9-thang-nam-2026/
- National Statistics Office of Vietnam (2026). Report on the socio-economic situation in the fourth quarter and the year 2025 (in Vietnamese). https://www.nso.gov.vn/du-lieu-va-so-lieu-thong-ke/2026/01/bao-cao-tinh-hinh-kinh-te-xa-hoi-quy-iv-va-nam-2025/
- Viet Nam News (2026). Several major laws to take effect from January 1, 2026. https://vietnamnews.vn/politics-laws/1733035/several-major-laws-to-take-effect-from-january-1-2026.html